Gravitas Dashboard

Healthcare Data, Simplified

High-Fidelity Prototyping / Stakeholder & Developer Collaboration
Client
LexisNexis
Company
DataPrime
Project Type
Web Design
Project Date
September 2023

Team Roster

UI Designer (myself)
Backend Developer
Frontend Developer

Project Summary

The Gravitas Dashboard is a health care portal, hosted by LexisNexis. We were tasked to create an appealing landing page, a catalog page for products, and a product page, highlighting each one for its details and metrics.

The Challenge

Like most dashboards, this project was intended to bring together large quantities of data, displaying them as individual “products”. The concepts we were tasked with had a very e-commerce feel. This intent was to help users more easily understand the data and how to use it for their purposes. This project was part of a larger scope, being handled by the stakeholder. Our responsibilities were to create three out of the total seven pages of the portal website. With that in mind, maintaining the same aesthetic, brand guidelines, and business standards was a key component in design and development and was constantly being tracked and validated.

The Process

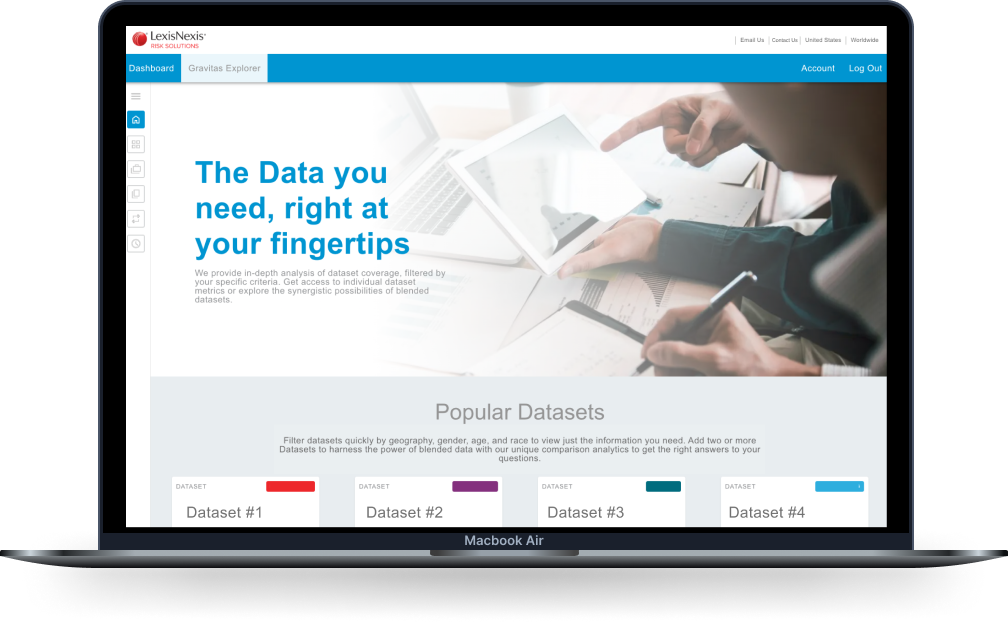
This first action I took on this project was thoroughly reviewing the Brand Style Guide for Lexis Nexis' Healthcare Portal. I took great care to make sure my designs would blend seamlessly into the existing site. I started building some simple components and styles in Figma. This is a vital first step because it allows me to design efficiently and consistently throughout the process.

We attended several stakeholder meetings to discuss initial design ideas and to regularly check in on progress week-by-week. This is where I would gather my design feedback and suggestions for improvement.

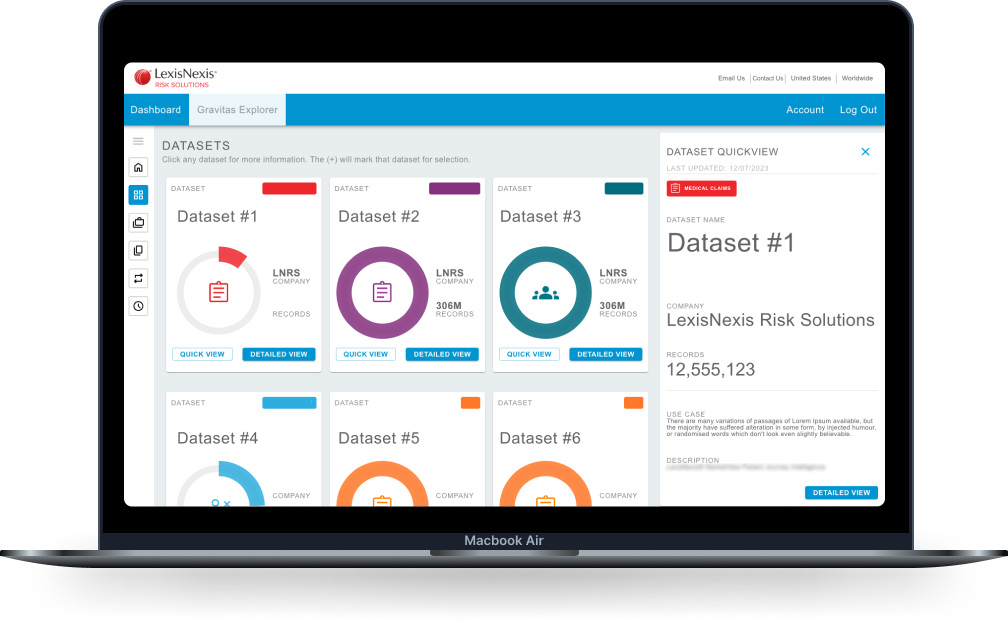
As I started building out the different pages, I worked closely alongside the Frontend Developer to ensure the feasibility of my designs and the accuracy of his implementation of my concepts. This collaborative effort was great to work with and ultimately led us to happy stakeholders when we presented the finished product.

The Solution

The Landing Page – The plan here was simple. This page needed to catch the user’s attention right off the bat, grabbing their attention and making them curious to what was being offered. Below the fold, I gave them a small taste of the data presented on a familiar card layout. The point was to build their curiosity, making them want to explore and discover the answer themselves.
The Product Catalog was the page to display all of the products offered. Here, I arranged the product cards in a grid for quick digestion. I utilized the same cards from the landing page to keep a consistent visual, this time offering a "Quick View" panel to grab a bit more information before the deep dive into each complex set of data.
A catalog view of healthcare data.
Once the user finally selected a product, then I unleashed the full breadth of information for that product. Data metrics, standard use cases, historical landscapes, data visualizations, this page was why they came to the site. From here users can deep dive into data and learn how to build it for their own cases.

The Results

The stakeholders were extremely happy with the end product and the efforts the team made to create a cohesive project that aligned with their branding and aesthetic.
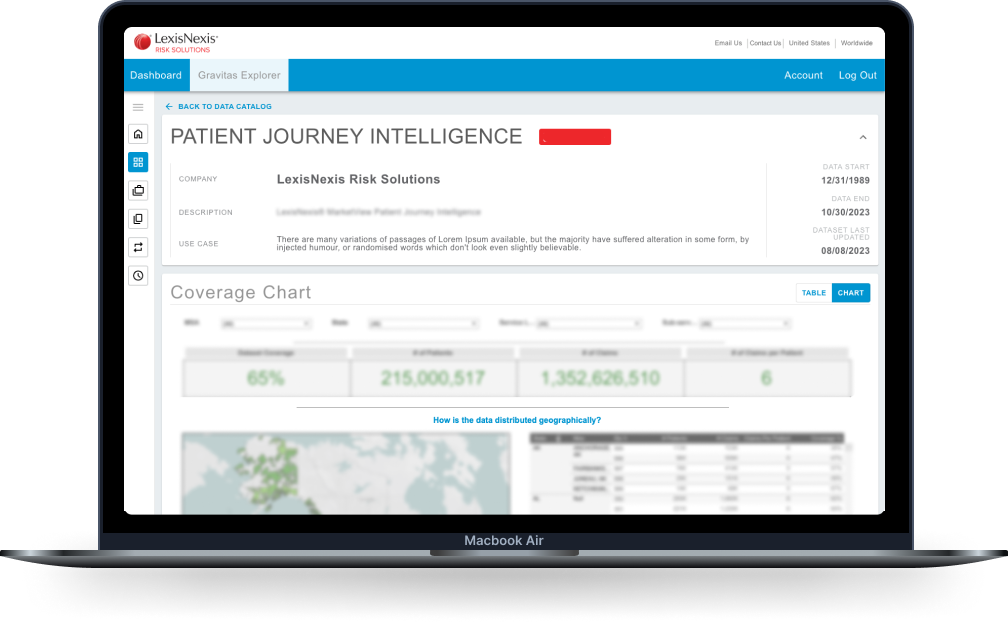
"Having a clean interface will reduce customer frustration on navigating to what they want to get data on, as long as it's clean and intuitive. And this dashboard is clean and intuitive. I really like this."

Lessons/Wins

Having already two required global headers, I helped stakeholders see the value in not adding a third header to navigate the pages we were creating. I designed an efficient left hand sidebar, gaining back some vital vertical real estate and adding a clean, organized navigation alternative. A small win that I was very proud to achieve.
Questions about this project? Drop me a line.
email me